ELEVATING MEDICAL IMAGING
A BROWSER-BASED BRAIN IMAGING AND ANALYTICS TOOL BY CEREHEALTH
Not all image analysis depicted in this video has received FDA clearance and is for research purposes only. Please contact CereMetrix for more information.
CEREMETRIX® FEATURES
CereHealth is committed to delivering faster, efficient, and more accurate care to a patient population that craves information. Providers are able to deliver informed diagnoses to patients through CereMetrix® features like:
Simplified data transfer and integration made possible through Nuance Powershare and HL7
Standardized image processing and state-of-the-art analysis to ensure consistency and confidence in radiologists’ findings
Objective statistics that mathematically support the radiologists’ findings
Multi-modality viewer and image fusion to demonstrate where structural and functional abnormalities coexist
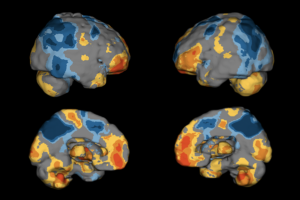
Advanced 2D and 3D annotated images that ease communication of findings to patients and their referring physicians and provide perspectives and insights that might typically go unnoticed
A software tool that can be accessed wherever there is an internet connection
An interactive interface that lets you, quite literally, see everything
Integrated annotation and screen capture tools that send output directly to a report
A browser-based tool that accelerated collaboration and communication for multi-site collaboration
Automated SPECT quantification that ensures objectivity and consistency
Pre/post comparisons to evaluate effects of treatments and therapies on patient health
Longitudinal analysis to track disease progression or treatment impacts over time
Dataset of over 2,000 heterogeneous patient SPECT brain scans averaged at the voxel level producing a composite brain resembling average blood flow
CEREMETRIX® INDICATIONS FOR USE

Receive, transmit, store, retrieve, display, print, and process brain images and DICOM objects derived from radiological diagnostic systems and processing workstations.
Create, display, and print reports from medical images.
Registration and review of brain images for diagnosis, treatment evaluation, and treatment planning.
Localization and definition of objects and the differentiation between hyper and hypo perfused tissue, as compared to a composite average, in medical images.
Creation of clusters for applications including quantitative analysis and archiving clusters for patient follow-up and management.
Processing and displaying the brain image data in traditional formats, as well as pseudo three-dimensional renderings.
Manual and automatic report creation plus the ability to review these reports remotely.
Quantitative and statistical analysis of SPECT brain scans by comparing to a composite average.
When used for diagnostic purposes, the mobile web client is not intended to replace a full workstation and should only be used when there is no access to a workstation.
The software is not to be used for computer aided diagnostic purposes, including mammography CAD.

CEREMETRIX® IS ACCESSIBLE THROUGH THE WEB
The CereMetrix® platform is cloud enabled, browser based, and secured in an accessible, HIPAA-compliant environment. Data is available anytime and anywhere through a computer, laptop, or mobile device connected to the internet.
CEREMETRIX® IS SUBSCRIPTION-BASED
START A TRIAL
Prior to subscribing, you can trial CereMetrix® by clicking on Start A Trial. There are no complex downloading or installation instructions. Our product team can walk you through how to process images and create and download reports.
PURCHASE A SUBSCRIPTION
To purchase a subscription of CereMetrix®, click on Contact Us and a member of our team will reach out to begin the process.
SUBSCRIBE THROUGH iLLUME Ai PLATFORM
CereMetrix® can also be accessed through a subscription to iLLUME Ai platform, a clinical and research tool that helps collect and manage patient data, including medical imaging.
WE HAVE THE A’S TO YOUR Q’S
CereHealth Corp.
Call: (855) 838-2241
Email: [email protected]
Link: Tech Support
Mail: 991 Southpark Dr., Suite 200, Littleton, CO 80120 USA
ABOUT CEREHEALTH
CereHealth is a healthcare technology company that has always understood the value of data and its potential to revolutionize brain health. Since our inception, we’ve continuously witnessed how quality data can generate actionable insights for clinicians, researchers, and patients alike.
Our mission is to create better experiences for providers and better outcomes for patients by developing software that streamlines the capture and analysis of medical data for the delivery of intelligent clinical decision support.
